Benchmarks | WICHE Region 2009

Summary

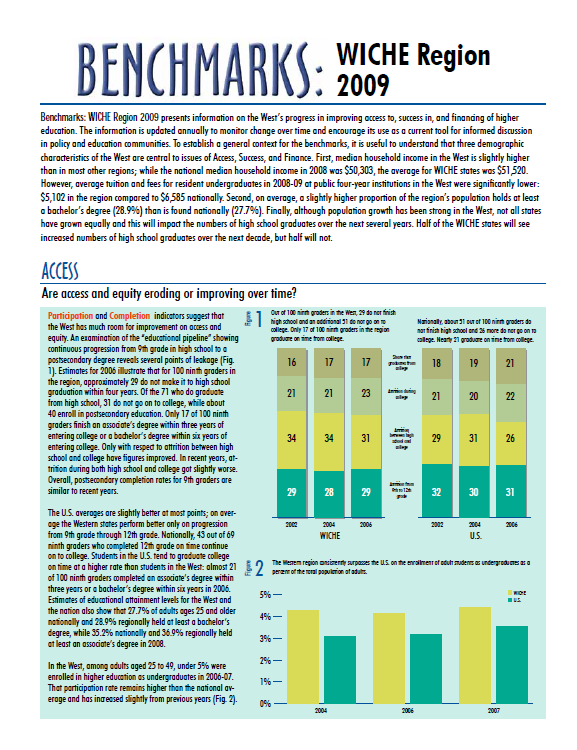
This report presents information on the West’s progress in improving access to, success in, and financing of higher education. The information is updated annually to monitor change over time and encourage its use as a current tool for informed discussion in policy and education communities, focusing demographics related to Access, Success, and Finance in the West. Figures 1-15 available in Excel file format, below.

Download Data Tables
Figure 1The Education Pipeline
Figure 2Undergraduate Enrollment Among 25-49 Year Olds as a Percent of Population
Figure 3Percentage of Public High School Completers as a Proportion of the Number of 9th Graders Four Years Earlier
Figure 4Share of Full-Time Undergraduate Enrollment by Race/Ethnicity vs. Share of Population by Race/Ethnicity, 1997-98 and 2007-08
Figure 5Share of Bachelor’s Degrees Awarded by Race/Ethnicity vs. Share of Population by Race/Ethnicity, 1996-97 and 2006-07
Figure 6College Participation and Impoverishment, 2007
Figure 7Average Resident Undergraduate Tuition and Fees at Public Four-Year Institutions
Figure 8Ratio of Tuition and Fees to Median Household Income, Public Institutions, 2009-10, 2004-05, and 1999-00
Figure 9Grant Aid per FTE in Public Institutions, 2003-04 to 2007-08
Figure 10Need-Based Grant Aid Awarded by State Grant Programs per FTE
Figure 11Percentage of First-Time Full-Time Degree/Certificate-Seeking Students Receiving Federal Grant Aid
Figure 12WUE Total Savings to Families and/or States
Figure 13Total State and Local Appropriations to Higher Education per FTE, Public Institutions, FY 2000 to FY 2008 (Adjusted)
Figure 14Revenues from State and Local Appropriations and Tuition and Fees per FTE, Public Institutions, FY 2000 to FY 2008 (Adjusted)
Figure 15State Tax Revenue Per Capita (Adjusted for Inflation)

Details

  • Year Published : 2009
  • Month Published : October
  • Media Type : pdf
Download PDF